Streamlit is an open-source Python framework that turns a plain Python script into an interactive web app, with no HTML, CSS or JavaScript required. It is aimed at data work: dashboards, internal tools and quick prototypes around pandas DataFrames and charts.
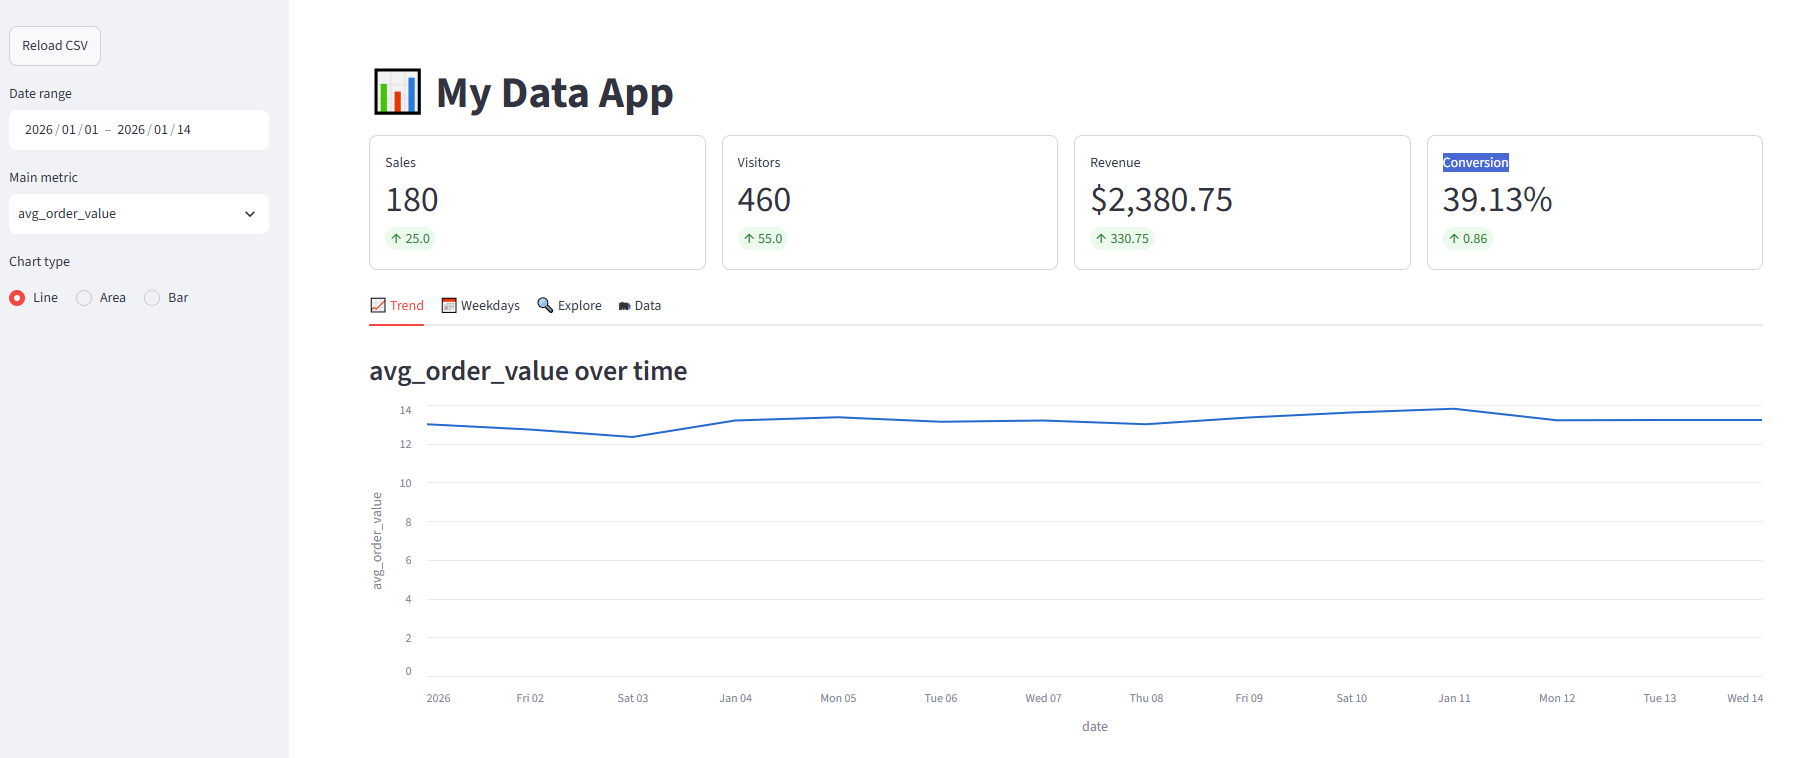
The finished app built in this post, with sidebar filters, KPI cards and a trend chart:
What is Streamlit?
A Streamlit app is a regular .py file. You call functions such as st.title, st.selectbox or st.line_chart, and Streamlit renders them as page elements in the browser.
The key idea is the rerun model: every time a user changes a widget, Streamlit runs the whole script again from top to bottom with the new widget values and updates only what changed on the page. There are no callbacks to wire up. A widget simply returns its current value.
streamlit run starts a Python server, the browser talks to it over a websocket, and all filtering and calculations happen live in Python. Changing the layout means editing the code (as in any web framework), but Streamlit picks up saved changes instantly, without a build step. The data itself is fully dynamic: swap the CSV for a database query and the app shows fresh numbers on every run.
The examples below use Streamlit 1.63.0 with pandas 3.0.
Input data
The app reads a small data.csv with two weeks of daily figures:
| date | sales | visitors | revenue |
|---|---|---|---|
| 2026-01-01 | 120 | 340 | 1560.50 |
| 2026-01-02 | 135 | 365 | 1720.00 |
| 2026-01-03 | 98 | 290 | 1210.75 |
| 2026-01-04 | 150 | 410 | 1980.25 |
| 2026-01-05 | 175 | 455 | 2340.00 |
| 2026-01-06 | 160 | 420 | 2100.50 |
| 2026-01-07 | 142 | 380 | 1875.00 |
| 2026-01-08 | 110 | 310 | 1430.00 |
| 2026-01-09 | 188 | 470 | 2510.75 |
| 2026-01-10 | 205 | 510 | 2790.00 |
| 2026-01-11 | 192 | 495 | 2650.25 |
| 2026-01-12 | 167 | 430 | 2205.50 |
| 2026-01-13 | 155 | 405 | 2050.00 |
| 2026-01-14 | 180 | 460 | 2380.75 |
On load the app adds two derived columns: conversion_rate (sales / visitors × 100) and avg_order_value (revenue / sales).
Setup
- Install the libraries - create and activate a virtual environment, then run
pip install streamlit pandas. Altair, used for one custom chart, is installed with Streamlit. - Run the app - from the folder containing
app.pyanddata.csv, runstreamlit run app.py. The app opens athttp://localhost:8501.
Run it from the project folder, not from inside venv, because the CSV is loaded by a relative path.
The code
import altair as alt
import pandas as pd
import streamlit as st

# --- Page setup -------------------------------------------------------------
st.set_page_config(page_title="My Data App", page_icon="📊", layout="wide")
st.title("📊 My Data App")

WEEKDAYS = ["Monday", "Tuesday", "Wednesday", "Thursday", "Friday", "Saturday", "Sunday"]
METRICS = ["sales", "visitors", "revenue", "conversion_rate", "avg_order_value"]


# --- Data loading -----------------------------------------------------------
@st.cache_data
def load_data(source) -> pd.DataFrame:
    df = pd.read_csv(source, parse_dates=["date"])
    # Derived columns: computed once and cached together with the raw data
    df["conversion_rate"] = (df["sales"] / df["visitors"] * 100).round(2)
    df["avg_order_value"] = (df["revenue"] / df["sales"]).round(2)
    return df.sort_values("date")


# --- Sidebar: all user inputs live here -------------------------------------
with st.sidebar:
    if st.button("Reload CSV"):
        st.cache_data.clear()

df = load_data("data.csv")

with st.sidebar:
    min_date, max_date = df["date"].min(), df["date"].max()
    date_range = st.date_input(
        "Date range", value=(min_date, max_date), min_value=min_date, max_value=max_date
    )
    metric = st.selectbox("Main metric", METRICS, index=2)
    chart_type = st.radio("Chart type", ["Line", "Area", "Bar"], horizontal=True)

# Wait until the user has picked both ends of the range
if len(date_range) != 2:
    st.info("Pick an end date to continue.")
    st.stop()

start_date, end_date = date_range
df = df[(df["date"] >= pd.Timestamp(start_date)) & (df["date"] <= pd.Timestamp(end_date))]

if df.empty:
    st.warning("No data in the selected range.")
    st.stop()

# --- KPI row ----------------------------------------------------------------
latest = df.iloc[-1]
previous = df.iloc[-2] if len(df) > 1 else latest

kpis = [
    ("Sales", "sales", "{:.0f}"),
    ("Visitors", "visitors", "{:.0f}"),
    ("Revenue", "revenue", "${:,.2f}"),
    ("Conversion", "conversion_rate", "{:.2f}%"),
]
for col, (label, field, fmt) in zip(st.columns(len(kpis)), kpis):
    col.metric(
        label,
        fmt.format(latest[field]),
        delta=round(float(latest[field] - previous[field]), 2),
        border=True,
    )

# --- Tabs -------------------------------------------------------------------
trend_tab, weekday_tab, explore_tab, data_tab = st.tabs(
    ["📈 Trend", "📅 Weekdays", "🔍 Explore", "🗂 Data"]
)

with trend_tab:
    st.subheader(f"{metric} over time")
    trend = df[["date", metric]].copy()

    if chart_type == "Line":
        st.line_chart(trend, x="date", y=metric)
    elif chart_type == "Area":
        st.area_chart(trend, x="date", y=metric)
    else:
        st.bar_chart(trend, x="date", y=metric)

    left, right = st.columns(2)
    left.caption("Totals for the selected range")
    left.dataframe(df[["sales", "visitors", "revenue"]].sum().rename("total"))
    right.caption("Daily averages")
    right.dataframe(df[METRICS].mean().round(2).rename("average"))

with weekday_tab:
    st.subheader(f"Average {metric} by weekday")
    by_day = (
        df.assign(weekday=df["date"].dt.day_name())
        .groupby("weekday")[metric]
        .mean()
        .reindex(WEEKDAYS)
        .dropna()
    )
    # Altair gives full control: fixed weekday order and tooltips
    weekday_chart = (
        alt.Chart(by_day.reset_index())
        .mark_bar()
        .encode(
            x=alt.X("weekday:N", sort=WEEKDAYS, title=None),
            y=alt.Y(f"{metric}:Q", title=f"avg {metric}"),
            tooltip=["weekday", alt.Tooltip(f"{metric}:Q", format=".2f")],
        )
    )
    st.altair_chart(weekday_chart, width="stretch")
    st.success(f"Best day for **{metric}**: **{by_day.idxmax()}** ({by_day.max():.2f} on average)")

with explore_tab:
    st.subheader("How do two metrics relate?")
    c1, c2 = st.columns(2)
    x_axis = c1.selectbox("X axis", METRICS, index=1)
    y_axis = c2.selectbox("Y axis", METRICS, index=0)

    st.scatter_chart(df, x=x_axis, y=y_axis, size="revenue")
    st.write(f"Correlation between **{x_axis}** and **{y_axis}**: `{df[x_axis].corr(df[y_axis]):.2f}`")

    with st.expander("Compare several metrics at once"):
        picked = st.multiselect("Metrics", METRICS, default=["sales", "visitors"])
        if picked:
            st.line_chart(df, x="date", y=picked)

with data_tab:
    st.subheader("Raw data")
    st.dataframe(
        df,
        hide_index=True,
        width="stretch",
        column_config={
            "date": st.column_config.DateColumn("Date", format="YYYY-MM-DD"),
            "revenue": st.column_config.NumberColumn("Revenue", format="$%.2f"),
            "avg_order_value": st.column_config.NumberColumn("Avg order", format="$%.2f"),
            "conversion_rate": st.column_config.ProgressColumn(
                "Conversion %", min_value=0, max_value=100, format="%.2f%%"
            ),
        },
    )

    st.download_button(
        "⬇️ Download filtered CSV",
        df.to_csv(index=False).encode("utf-8"),
        file_name=f"data_{start_date}_{end_date}.csv",
        mime="text/csv",
    )

    with st.expander("Summary statistics"):
        st.dataframe(df[METRICS].describe().round(2))
How it works
- Caching -
@st.cache_datastores the loaded DataFrame, so the CSV is read once rather than on every rerun. The Reload CSV button clears the cache to pick up edits to the file. - Sidebar - anything inside
with st.sidebar:is rendered in the left panel, keeping filters apart from the results. - Early exit -
st.stop()halts the script while the user has picked only one end of the date range, or when the filter returns no rows. - KPI cards -
st.metricshows the latest value and the change from the previous day, coloured green or red automatically. - Layout -
st.columnsplaces elements side by side,st.tabssplits the page into views andst.expanderhides secondary content. - Built-in charts -
st.line_chart,st.area_chart,st.bar_chartandst.scatter_charttake a DataFrame and column names directly. - Custom charts -
st.altair_chartrenders any Altair chart; here it keeps weekdays in calendar order and adds tooltips. - Table formatting -
column_configformats columns as dates and currency, and draws the conversion rate as a progress bar. - Download -
st.download_buttonexports the currently filtered data as a CSV.
Screenshots
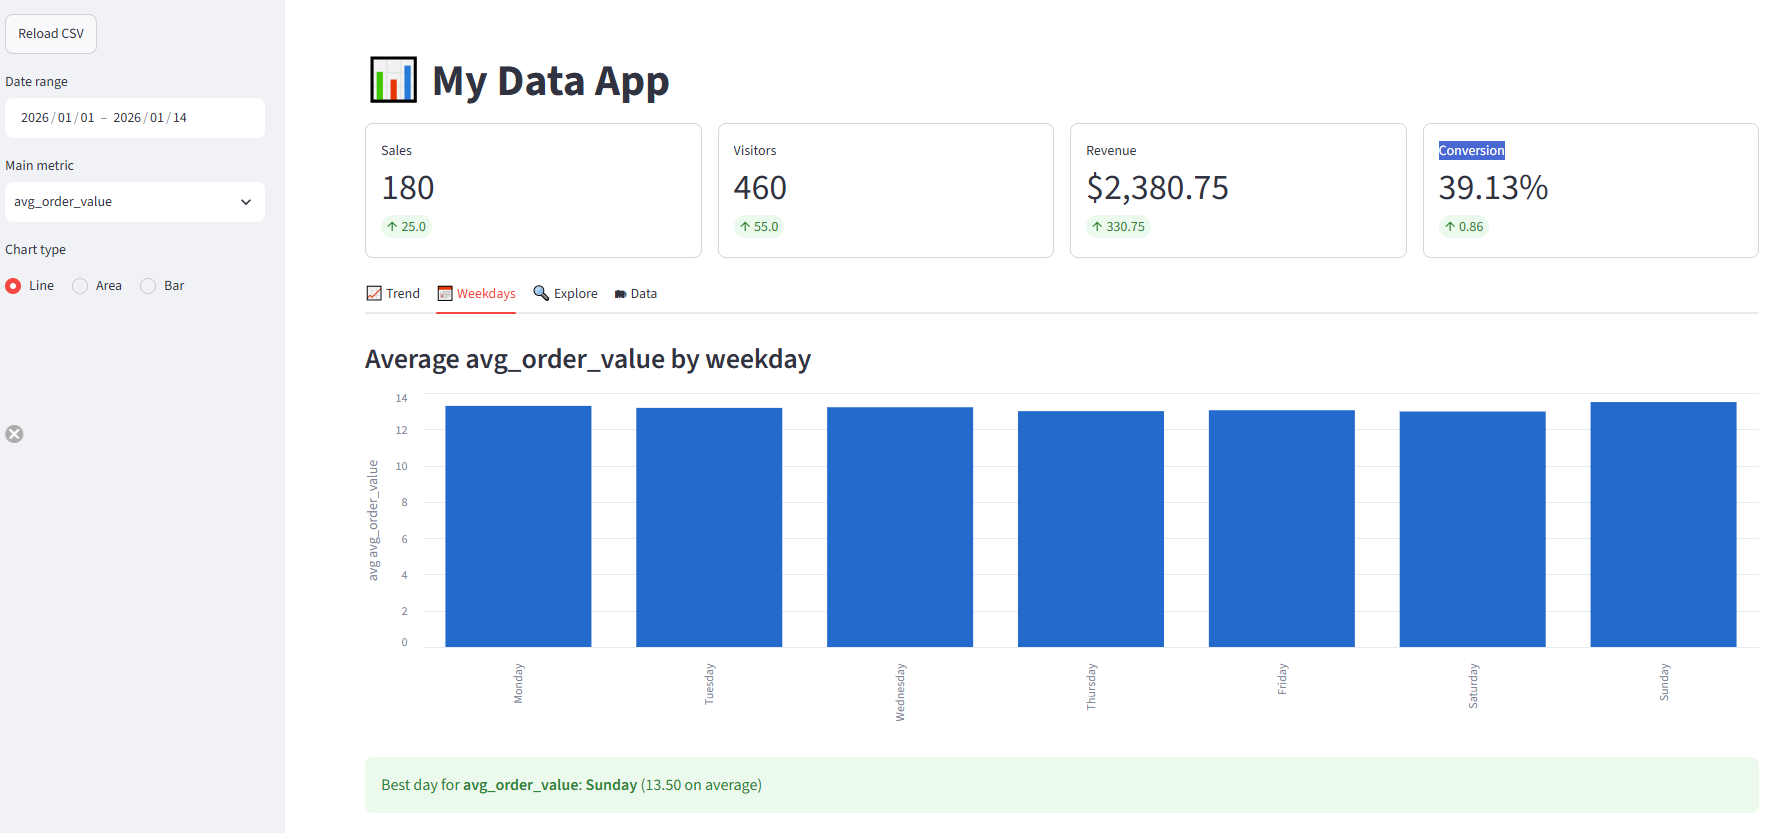
Average order value by weekday, rendered with Altair, with Sunday highlighted as the best day:
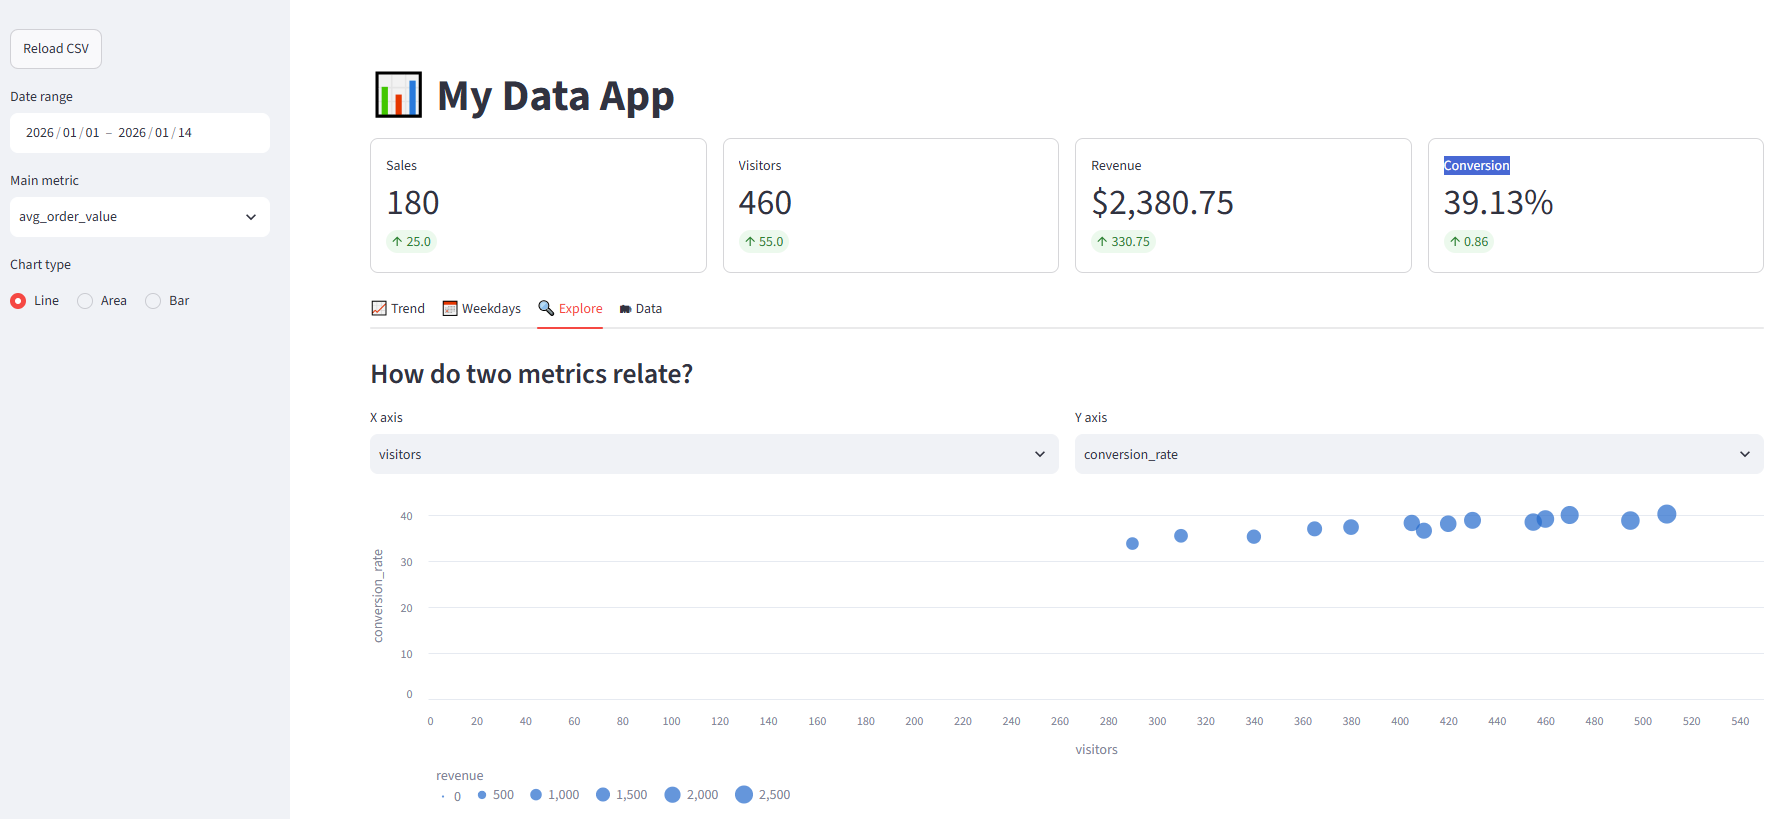
Scatter chart of visitors against conversion rate, with point size driven by revenue:
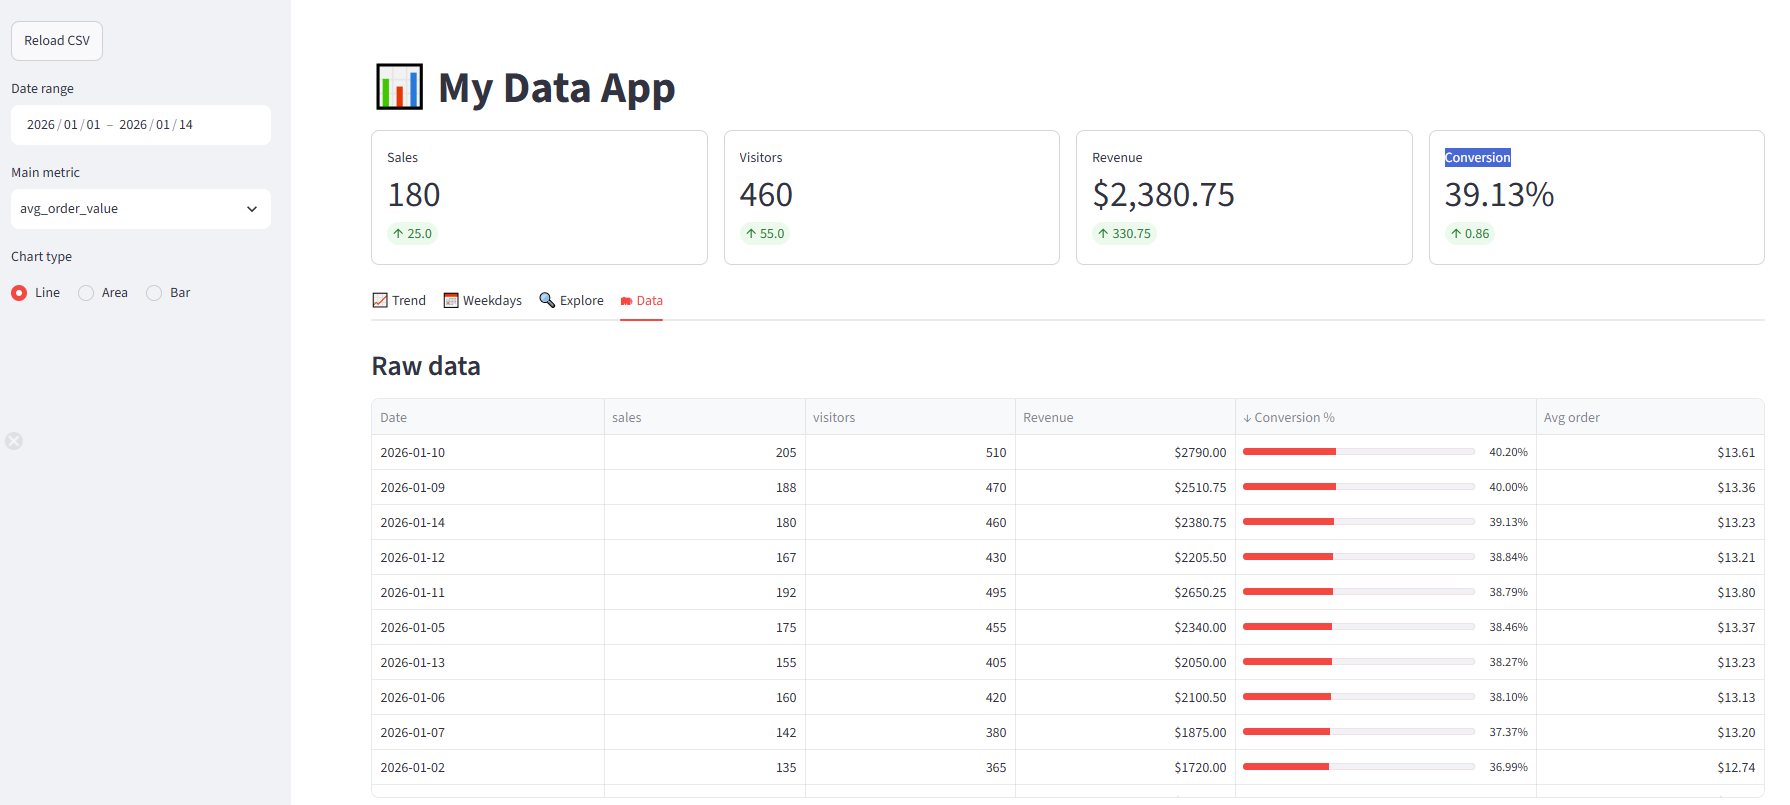
Raw data formatted with column_config, sorted by conversion rate (click a column header to sort):
Deploying
A Streamlit app needs a running Python server, so it can be hosted on Streamlit Community Cloud (free for public apps), in a Docker container on any cloud, or directly inside Snowflake.
Streamlit in Snowflake
Snowflake acquired Streamlit and runs Streamlit apps natively next to the data, using Snowflake roles for access control and Snowflake compute to run the app. Instead of reading a CSV, the app queries Snowflake tables directly, so the data never leaves the platform. Apps can be created in the Snowsight UI, with SQL or with the Snowflake CLI:
- Getting started with Streamlit in Snowflake - deploy a first app in a few minutes
- Create your Streamlit app - Snowsight, SQL and Snowflake CLI options, plus CI/CD with GitHub Actions
Limitations
- Full reruns - every widget change reruns the whole script, so slow data loading or heavy calculations need
@st.cache_dataorst.cache_resourceto keep the app responsive. - Limited layout control - columns, tabs and the sidebar cover most dashboards, but pixel-precise layouts are hard to achieve.
- Best for internal tools - Streamlit fits data apps, prototypes and team dashboards. Complex customer-facing apps with many users, authentication flows or fine-grained state are better served by a full web framework.